Skip to content

How to make the most of Earth observation data and not perish in the attempt?

Earth observation data

Gerardo Lopez-SaldanaGerardo Lopez-Saldena, Earth observation application specialist with Assimila, has written a fascinating blog, which first appeared on the Space for Climate website.

It takes us on a journey through the highs and lows of working with Earth observation data.

Early images of the Earth from space provided a new and unique view of the complexity and beauty of global weather systems – opening our eyes to the possibilities of measurement from space.

Technology has evolved enormously since then, giving us the array of satellites and sensors that we have today, with much of the data being free to use. These data bring huge opportunities – but challenges too. Just how do we make the most of these data without perishing in the attempt?! Read on …

Before discussing any of the challenges when using Earth observation (EO) data and how to overcome them to make the most of it, it would be relevant to first ask, why on Earth do you want to use EO data?

Well, let us go back in time some decades to the sixties. Between 1996 and 1967 NASA send several Lunar Orbiters spacecrafts to select the Apollo landing sites on the moon. Even though images acquired from these orbiters were used to map the moon, some stunning images of the Earth were taken, this image shown in Figure 1 produced by the Lunar Orbiter Image Recovery (LOIRP) project is worth more than thousand words.

NASA-lunar-photo
Figure 1. Image of the Earth produced by the Lunar Orbiter Image Recovery Project. Image credit: NASA/LOIRP.

This image provided an unseen perspective of our planet, it was one of the first opportunities to see cloud patterns at a planetary scale. Going back to our original question, the first reason of why we want to use EO data is because it provides a unique perspective of the Earth.

Technology has evolved massively since the sixties and the Lunar Orbiter images. Over time multispectral sensors dedicated to observing the Earth from satellites have been developed. The Landsat programme is the longest-running effort for acquisition of images of the Earth. The first Landsat satellite (originally named Earth Resources Technology Satellite) was launched in 1972. Since then, there had been several generations of these satellites hosting better and better instruments, Landsat-8 is the current operation satellite, next one will be Landsat-9 schedule for launch on September 2021. An example of the great quality of these images can be seen in Figure 2, the image shows Mexico City in a so-called true colour, meaning that the images used the red, green and blue channels to mimic what the human eye would see.

Mexico City in a so-called true colour
Figure 2: Mexico City in a so-called true colour, meaning that the images used the red, green and blue channels to mimic what the human eye would see. From Landsat8.

Somehow, this gives us the second reason for using EO data, consistency. Consistent observations are required to analyse any environmental phenomena. If we want to characterise the land surface or the ocean currents or sea ice extent, we do need that the observations are acquired in an organised and systematic manner. That is one the main reason EO programmes exist, for instance Copernicus is the European Union’s EO programme builds on three components, space, in-situ observations, and services. One of the main space missions within the space component is Sentinel. There are several Sentinel satellites, for instance Sentinel-2 main goal is land monitoring, first satellite was launched in June 2015 and another one in 2017. Sentinel-3 is dedicated for marine observations and Sentinel-5P to air quality monitoring.

The key element in here is that observations from these satellites can be used together, with some interesting cross-calibration challenges, but it is possible to do it, e.g. use Landsat-8 and Sentinel-2 to monitor vegetation condition.

This leads to one more reason to use EO data, we can (and must) consider the uncertainties in the observations. EO is way more than using Google Maps to have a look around our local town. EO provides way more than lovely pictures, the nice picture is just a pictographic representation of some physical units, for instance this Sentinel-2 image of Guildford, Surrey and surroundings in Figure 2 provides the surface reflectance, the proportion of the energy reflected by the land surface after removing atmospheric effects (feel free to have a look to the whole UK mosaic produced at Assimila). The image is a false colour composite, we used the short-wave infrared, the red and the green to enhance vegetation features in the image.

Sentinel-2-image-of-Guildford-Surrey
Figure 3. Sentinel-2 mosaic of the UK created using all images available during Spring 2020.

And you know what the best is, all these images, all these data, everything is for free. You can download old Landsat images from the seventies, the latest Sentinel-2 from literally a few hours after the satellite overpass, all for free. Now that you have images that provide a full planetary perspective, consistent observations and (hopefully) a way to assess the quality those observations, how do you use these vast amounts of data? There is no straight forward solution, there is no silver bullet, not one-size-fits-all tool to discover, access, process and analyse EO data. What we can say from the Assimila perspective is that a technology that allows you to discover and get access to the data, a tool that can keep an up-to-date catalogue of the variables you need and can remove the barrier to perform an uncertainty and quality assessment (QA) and finally helps you to perform the analysis required, that would be a great toolbox.

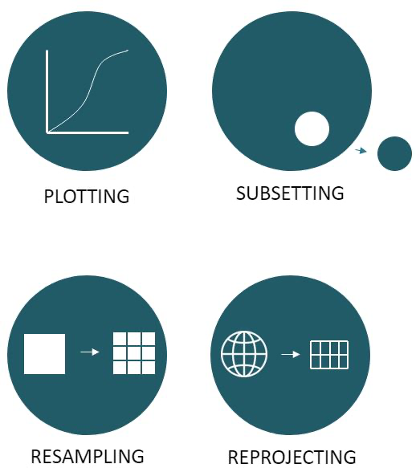
The Assimila Data Cube was born from the need to do all of that for us, to stop having ourselves a copy of the same image 20 times in different locations, to rewrite a script to perform QA analysis for similar EO products just changing a few parameters here and there, to being able to create prototypes in an easy way, to handle images in different spatial resolutions, to save data in different formats… etc, etc. Figure 4 shows the core tasks that you can do in it.

Then, how to make the most of EO data and not perish in the attempt? How about trying the Assimila Data Cube? You can access a wide range of EO and reanalysis datasets such as MODIS and VIIRS data via the LP-DAAC, ERA5 on the CDS and Sentinel-2 on the Open Access Hub. You can create a catalogue with the data, download or access the data in a cloud environment. You can take care in a very simple way of applying all the QA flags needed or associated uncertainties. Do not get worries about different spatial reference systems, the Data Cube will handle them for you. How do you need your data?, CSV for single point location (just because you want it!), yes we can, a Cloud Optimised GeiTiff (COG), yes we can, you speak weather and climate data and you want all your analysis results on a NetCDF file, yes we can, this is a have it your way EO data. And last but not least, if you speak Python, you can use a powerful API to access the data, if you prefer a simple Jupyter Notebook interface, we have it as well, have a look in here,. you can visualise data in there and create plots from your web browser. If you prefer a GIS system, we have a QGIS plugin as well.

Again, there is no one-stop shop for accessing and processing EO data but in Assimila we have one that works for us and that allows to start making our science and product development in an easier way, we have been making the most of EO data products for more than a decade and have not perish in the attempt. Not yet.

The core tasks that you can perform in the Assimila Data Cube.
Figure 4. Assimila Data Cube core features.
Crop analysis system

ACROPALIS – the Assimila crop analysis system

Assimila is developing and expanding its information services for agriculture!
waters around Spain's Balearic Islands

Earth observation data for climate – a potted history

After 30 years working at the interface between Earth observation science and public policy, Zof Stott brings an immense wealth of experience to Assimila.
Maize farmer

Forecasting maize yields in Ghana

Assimila is working with Farmerline, University College London and CABI-Africa to develop an operational system for forecasting maize yields in Ghana using a crop model, coupled with Earth observations and