Assimila is developing and expanding its information services for agriculture!
Working with ADAS and Crop4Sight the Assimila Crop Analysis System (ACROPALIS) is being used to develop operational products for UK farmers – focussing initially on potatoes, winter wheat and barley, but with the aim of expanding to cover multiple crops and ultimately achieving a more global reach.
ACROPOLIS is an agricultural analytics system, which harnesses satellite and weather data, and couples it with crop models – with the potential to provide a whole range of crop intelligence products and services. These include: field benchmarking, crop yield forecasts, canopy cover data and information about key stages in crop development.
The suite of products is designed to help farmers maximise productivity support their decisions about crop types, varieties and management, ensure efficient farm inputs (fertilisers and irrigation for example) and enhance sustainability. Furthermore, it is designed to work at a ‘field’ level which is a commonly used convenient base unit of area in the farming and agronomics world.
By linking ACROPOLIS with the ADAS Yield Enhancement Network (YEN) we can enhance the YEN benchmarking service. Similarly, we are also working with Crop4Sight, using ACROPALIS to monitor potato crop canopy development as part of their potato yield services. To our knowledge, this is the first time an Earth observation solution has been integrated with a potato yield analysis system of this type.
ACROPOLIS is built upon sophisticated algorithms as well as machine learning techniques using microwave and optical Earth observation data to derive information about crop state (such as leaf area index (LAI), canopy cover, above ground biomass and chlorophyl content). Combining this satellite-derived vegetation data, with crop models and weather and climate information, a wide variety of crop intelligence products and services can be delivered.
ACROPALIS offers information for historical analysis, near real-time monitoring, and future forecasting.
ACROPOLIS can be used for a range of crop intelligence services:
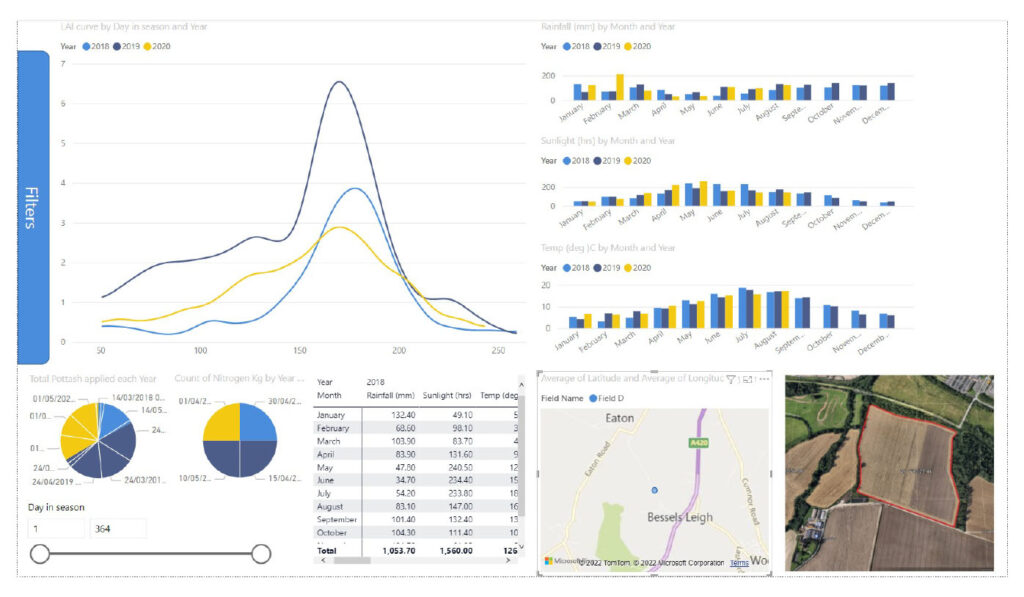
- Field benchmarking gives famers a means to compare their crop performance against historical reference data. ACROPOLIS provides satellite-derived vegetation information and weather data which can be combined with yield and crop management information (such as cultivar used, planting date, irrigation etc.). Using this information from past years can help users understand the various influences on crop growth and yield. Aggregation of this data gives a reference or benchmark of typical performance.
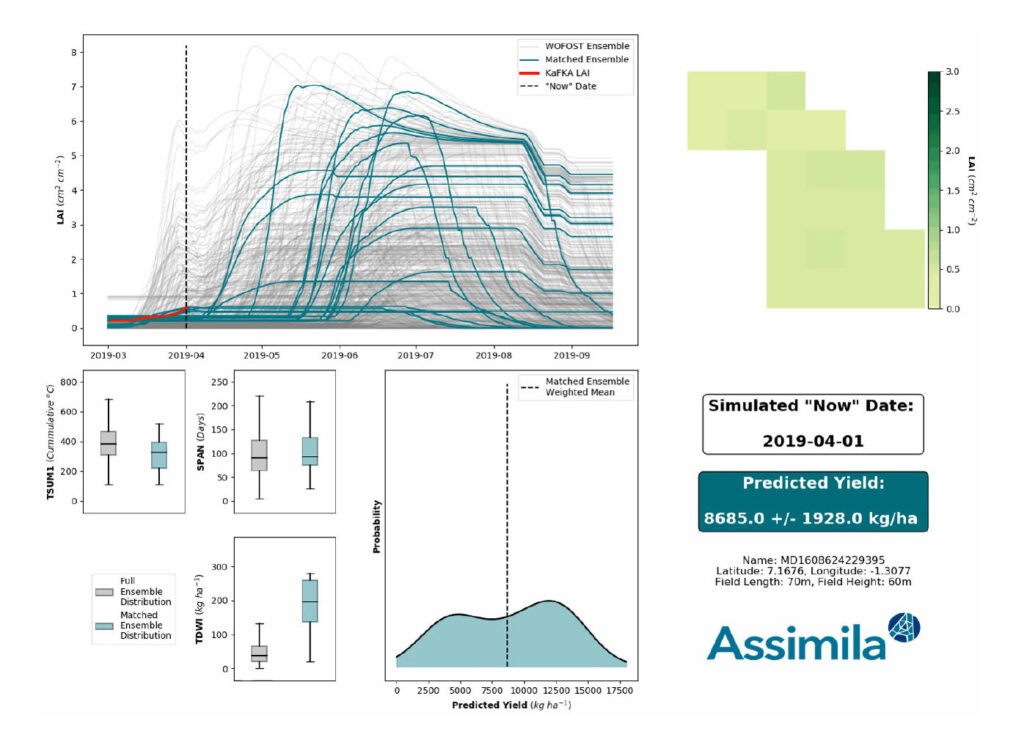
- Yield intelligence – enables predictions of attainable yield on a range of timescales. A yield outlook (available early to mid-season) gives an indication of attainable yield at harvest time and how it compares with previous years. A forecast (available later in the season) presents a predicted range of attainable yield, followed by an estimate of yield that is made available near, or at, harvest time.
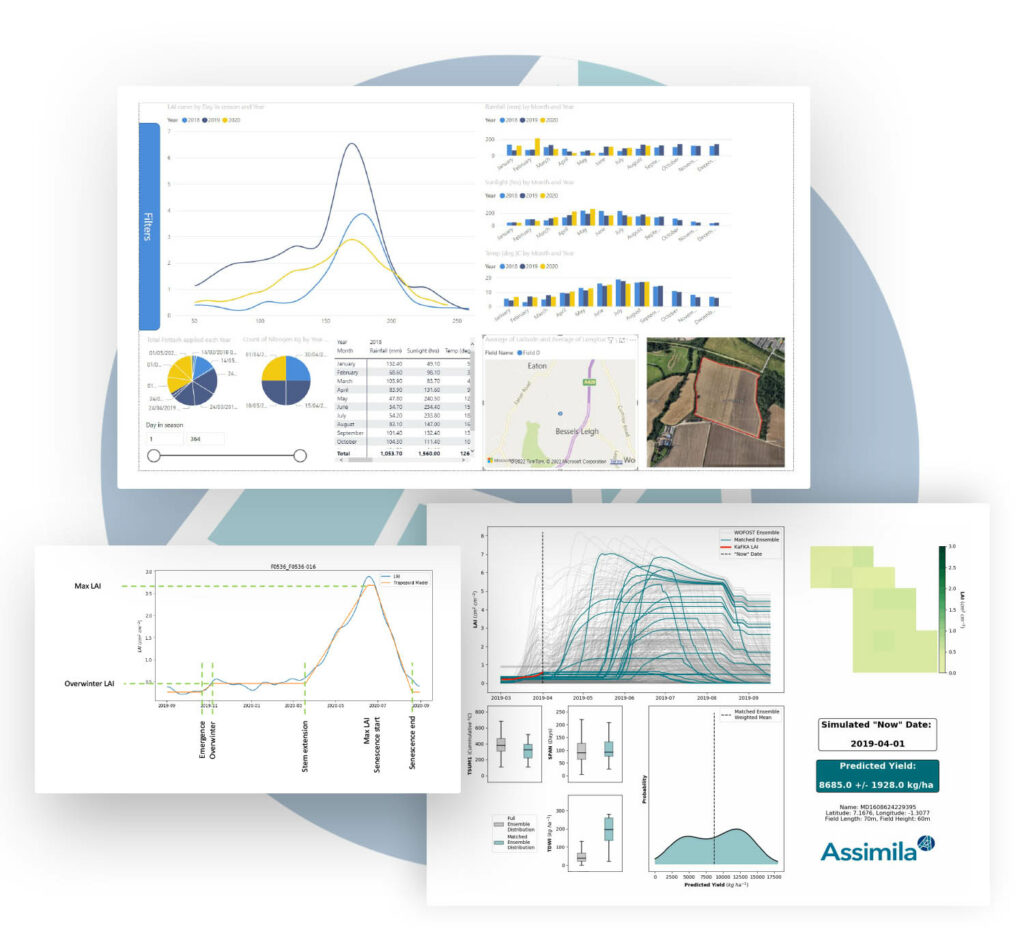
- ACROPOLIS yield predictions are generated using the World Food Studies (WOFOST) crop model and by producing an ensemble of possible crop growth and yield. Earth observation data are used to monitor the growth and health of the crop in near real-time (with a lag of 1 to 2 weeks) to enable the fine tuning of the outcomes from the WOFOST crop model ensemble.
- Crop canopy data – canopy parameters produced throughout the growing season can provide quantitative information regarding the percentage of ground surface covered by crop canopy vegetation. This information is used as input to crop development models.
- Key phenological events – Leaf Area Index (LAI) and the fraction of absorbed photosynthetically active radiation (FAPAR) are used to monitor the development of surface vegetation over time. In turn this information can be used to indicate key phenological crop events such as emergence, development, ripening and senescence.
The ACROPOLIS benchmarking capability is being used within the ADAS Yield Enhancement Network (YEN). YEN brings together farmers and crop performance specialists to share data about yield performance to better understand the reasons for variability and to determine optimum practices.
Benchmarking is used to aggregate data from all YEN fields to create a statistical reference of achieved yields. Any single field can then be compared with the reference to ‘benchmark’ how that field is performing both from an inter-field perspective as well as from year-to-year.
A range of other data, such as weather, planting date, cultivar etc., can then be used to determine the variables and practices that drive yield performance.
Using the ACROPOLIS system, satellite-derived vegetation metrics (for example, leaf area index and phenological events such as emergence) are being incorporated into the ADAS YEN benchmarking system.
Working with Crop4sight, ACROPOLIS is being used to provide canopy cover information for the monitoring of the growth of potato crops. Canopy cover refers to the fraction of the ground covered by the leaves of the crop. A healthy canopy of leaves is crucial for a good crop of potatoes and so canopy cover is used as a measure of plant development stage and when incorporated into a suitable crop model can determine the likely yield of a growing potato plant.
Once the stem and leaves of the potato plant begin to emerge, it is important for farmers to regularly measure how the canopy cover develops. This, when used with an appropriate model, can be used to give an indication of yield, and thus inform management actions such as irrigation or application of fertiliser as well as considerations of impacts of potato variety, weather conditions and much more.
Traditionally farmers have assessed their crops’ canopy cover manually, for example, by going into the field and taking photographs for analysis and interpretation. Using satellite data to derive canopy cover offers a much more efficient and less labour intensive method for farmers, and provides a comprehensive view of crops across many fields and throughout the season.
Assimila are working with Crop4Sight to test this system, gathering in-situ data from farmers for comparison with a view to providing this as an operational service.